Integrating Multiple DC Power Supplies with a Pulse Power Unit | AOT Technical Support
AOT Technical Support · Power-System Integration

Integrating Multiple DC Power Supplies with a Pulse Power Unit

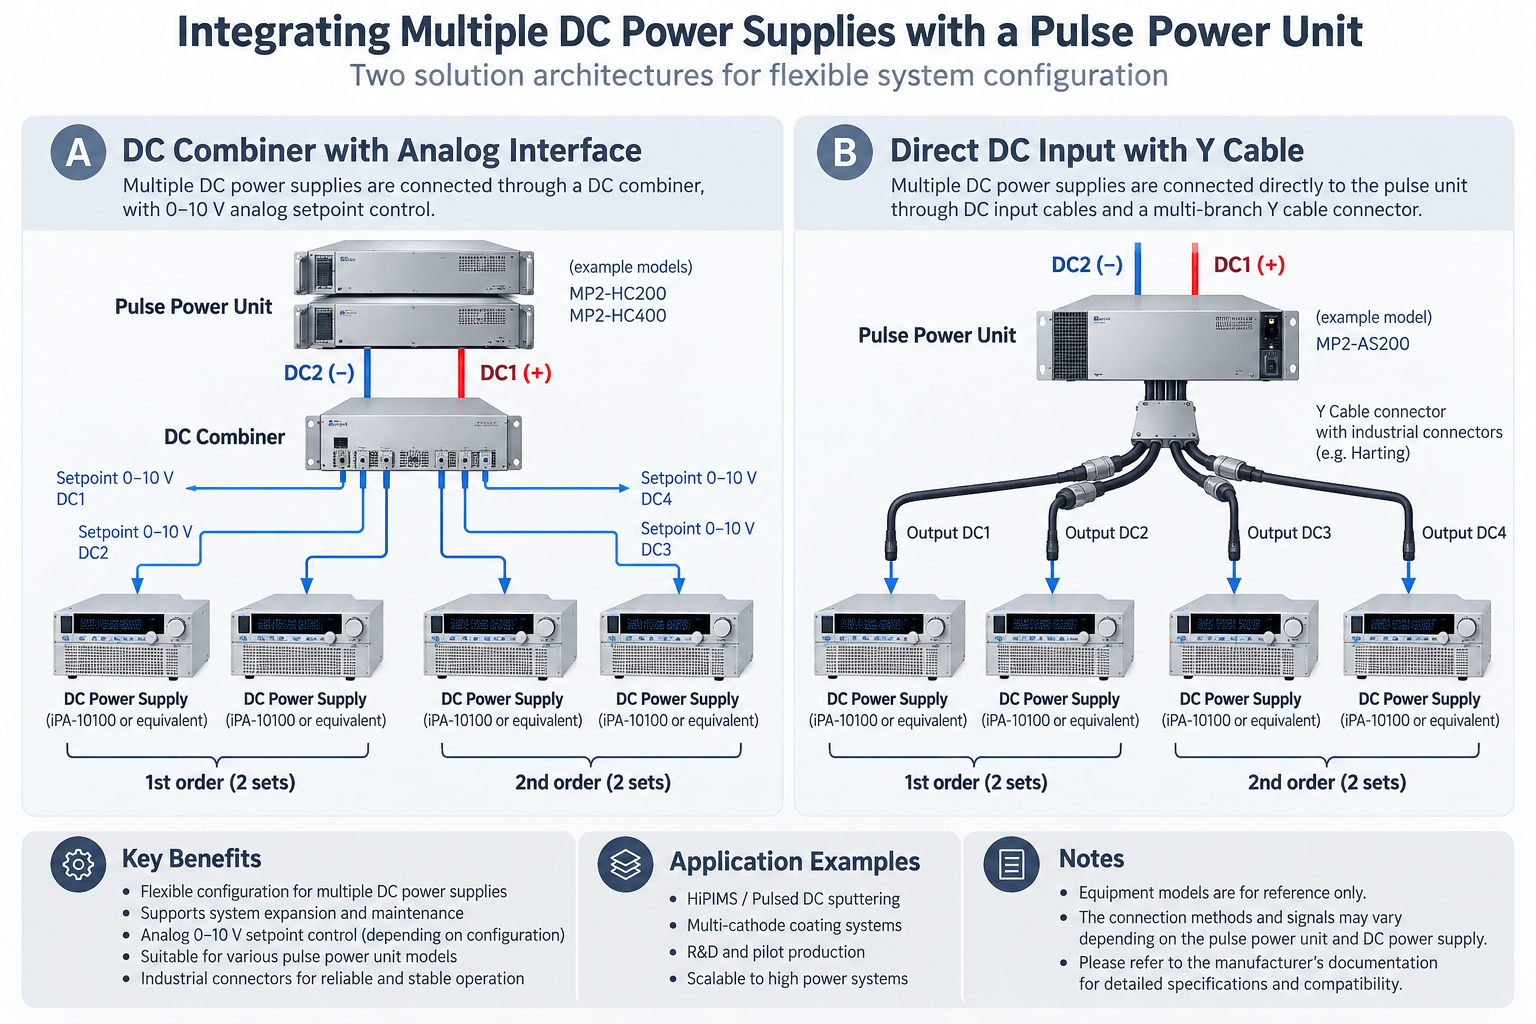
Two general connection approaches for integrating multiple DC power supplies with a pulse power unit: an interface-based architecture using a DC combiner, and a cable-based architecture using a multi-branch cable assembly.
Application note System integration concepts Engineering reference
Purpose and scope. This article presents general integration concepts based on a previous multi-supply configuration. Customer-specific context and model-specific labels have been removed to keep the article broadly applicable. Diagrams are conceptual, not wiring diagrams or declarations of compatibility.
Integrating multiple DC power supplies with a pulse power unit: comparison of a DC combiner architecture and a multi-branch cable architecture
Figure 1. Conceptual comparison of two approaches for integrating multiple DC power supplies with a pulse power unit. Model labels and connections are illustrative; confirm the actual configuration with the equipment manufacturer.

01 · Architecture A — Interface and DC Combiner

Each DC power supply connects through a defined control/interface connection to a DC combiner. The combiner provides the system-level connection to the pulse power unit. The reference configuration showed four DC supplies and four individual 0–10 V DC setpoint labels.

DC supply 1Setpoint / interface
DC supply 2Setpoint / interface
DC supply 3Setpoint / interface
DC supply 4Setpoint / interface
→
DC CombinerDefined interface
→
Pulse power unitDC connections
Group / stage 1 · 2 supplies Group / stage 2 · 2 supplies

Conceptual illustration only. Confirm signal path, power path, polarity, and connector assignment from equipment documentation.

Potential characteristics

  • A dedicated combiner serves as the defined integration point.
  • Individual control/setpoint channels may be identified at system level.
  • The architecture can be documented and inspected as a distinct subsystem.

Items to confirm

  • Interface type and pin assignment.
  • Setpoint range, reference potential, and isolation requirements.
  • Permitted number and configuration of connected supplies.

02 · Architecture B — DC Input Cable and Multi-Branch Connector

DC input cables connect the power supplies to the pulse power unit through a multi-branch cable assembly. The reference configuration used a Y-cable concept with industrial multipole connectors and four output labels.

DC supply 1DC input cable
DC supply 2DC input cable
DC supply 3DC input cable
DC supply 4DC input cable
→
Multi-branch cableConnector assembly
→
Pulse power unitDC connections
Output channel 1 Output channel 2 Output channel 3 Output channel 4
Group / stage 1 · 2 supplies Group / stage 2 · 2 supplies

Conceptual illustration only. Specify the actual cable topology, connector model, and pin assignments for each system.

Potential characteristics

  • Uses a dedicated cable assembly as the interconnection element.
  • May simplify the visible system layout when well documented.
  • Requires precise control of cable construction and connector pinout.

Items to confirm

  • Connector part numbers and contact assignments.
  • Current and voltage ratings for each conductor and connector.
  • Cable length, conductor size, grounding, shielding, and strain relief as applicable.

03 · Architecture Comparison

Consideration Interface / DC combiner Multi-branch cable assembly
Integration element Dedicated DC combiner and defined interface DC cables and multi-branch connector assembly
Control / channel identification May include individual setpoint or interface channels Defined by approved cable wiring and channel mapping
Main documentation need Interface specification, combiner documentation, system diagram Cable drawing, connector pinout, conductor ratings, channel map
Selection basis Compatibility and the combiner’s specified function Compatibility and cable assembly electrical/mechanical ratings

Neither approach is universally preferable. Selection depends on manufacturer-approved configuration, electrical ratings, control requirements, maintainability, and intended operating conditions.

04 · Engineering Verification Checklist

  • Confirm exact models and manufacturer-approved compatibility of all power supplies, combiner/interface hardware, and pulse unit.
  • Verify output voltage/current ratings, polarity, grounding, isolation, and restrictions on connecting multiple supplies.
  • Document the distinction between control/setpoint wiring and the DC power path.
  • Verify connector part numbers, pin assignments, current capacity, cable construction, and strain relief.
  • Define each channel and any installation group/stage label; do not infer this from a conceptual drawing.
  • Review protection, interlocks, emergency-stop behavior, and safe energization procedures against manuals and site requirements.
  • Release an approved wiring diagram and bill of materials before implementation.
Important limitation. This article is a general engineering reference. It is not a wiring instruction, product specification, compatibility certification, or substitute for manufacturer documentation and an approved design review.
AOT Technical Support
Generalized from a prior multi-DC-power-supply integration proposal. Actual implementation details must be established for each system.
Design concept for high-peak-current pulse generation MP2-HPP3000

MP2-HPP3000 | AOT Technical Support

AOT Technical Support / Power Supply Integration

MP2-HPP3000

Design concept for high-peak-current pulse generation using two DC power supplies with different voltage settings.


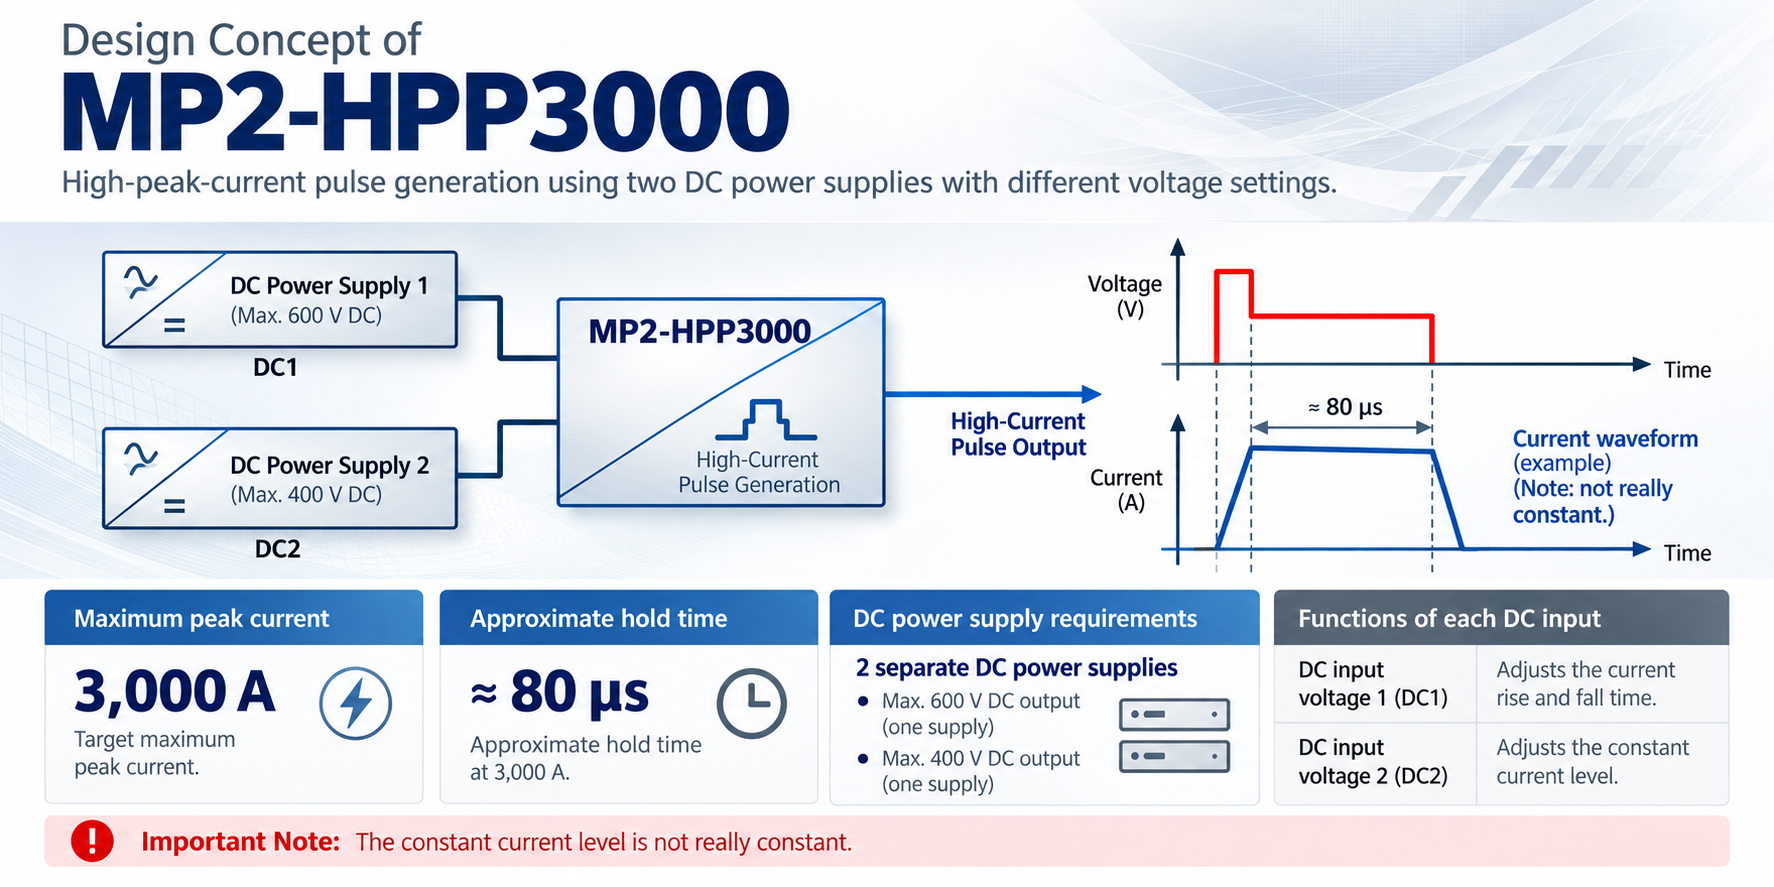
The MP2-HPP3000 concept combines two separately connected DC power supplies with different voltage settings to generate a high-current pulse. The source design concept specifies a target maximum peak current of 3,000 A and an approximate hold time of 80 microseconds at 3,000 A.

3,000 ATarget maximum peak current
~80 microsecondsApproximate hold time at 3,000 A
2 DC suppliesSeparate supplies with different voltage settings

Functional roles

InputFunction described in the source
DC input voltage 1 (DC1)Adjusts current rise and fall time.
DC input voltage 2 (DC2)Adjusts the current level during the pulse plateau.

Power-supply requirements

The concept calls for two separate DC power supplies: one with a maximum output of 600 V DC and the other with a maximum output of 400 V DC. The source does not specify which voltage rating maps to DC1 or DC2, so no mapping is assumed here.

Concept diagram

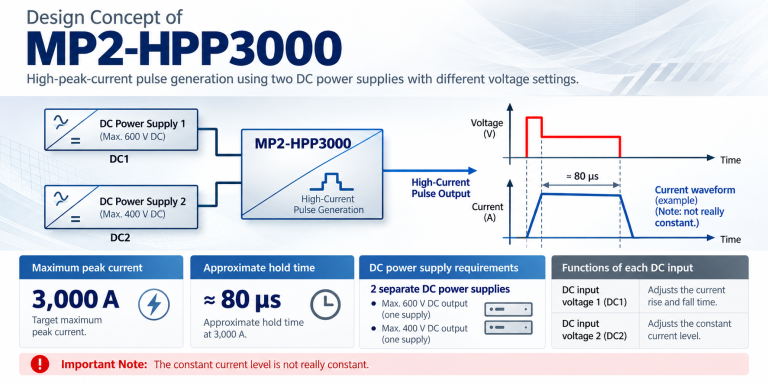
Generic MP2-HPP3000 concept infographic showing two DC power supplies feeding a high-current pulse-generation unit, with illustrative voltage and current waveforms
Concept illustration. The waveforms are illustrative and should not be interpreted as verified test results.
Applied Optivac Technology, Inc. (AOT) | Technical Support

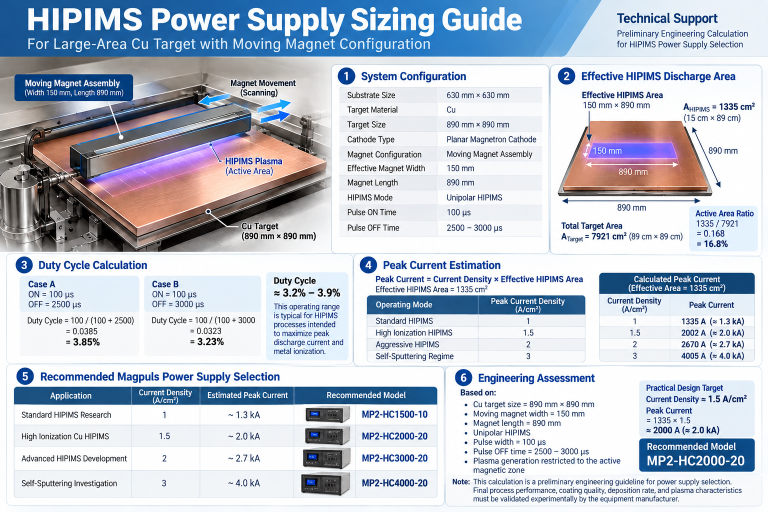
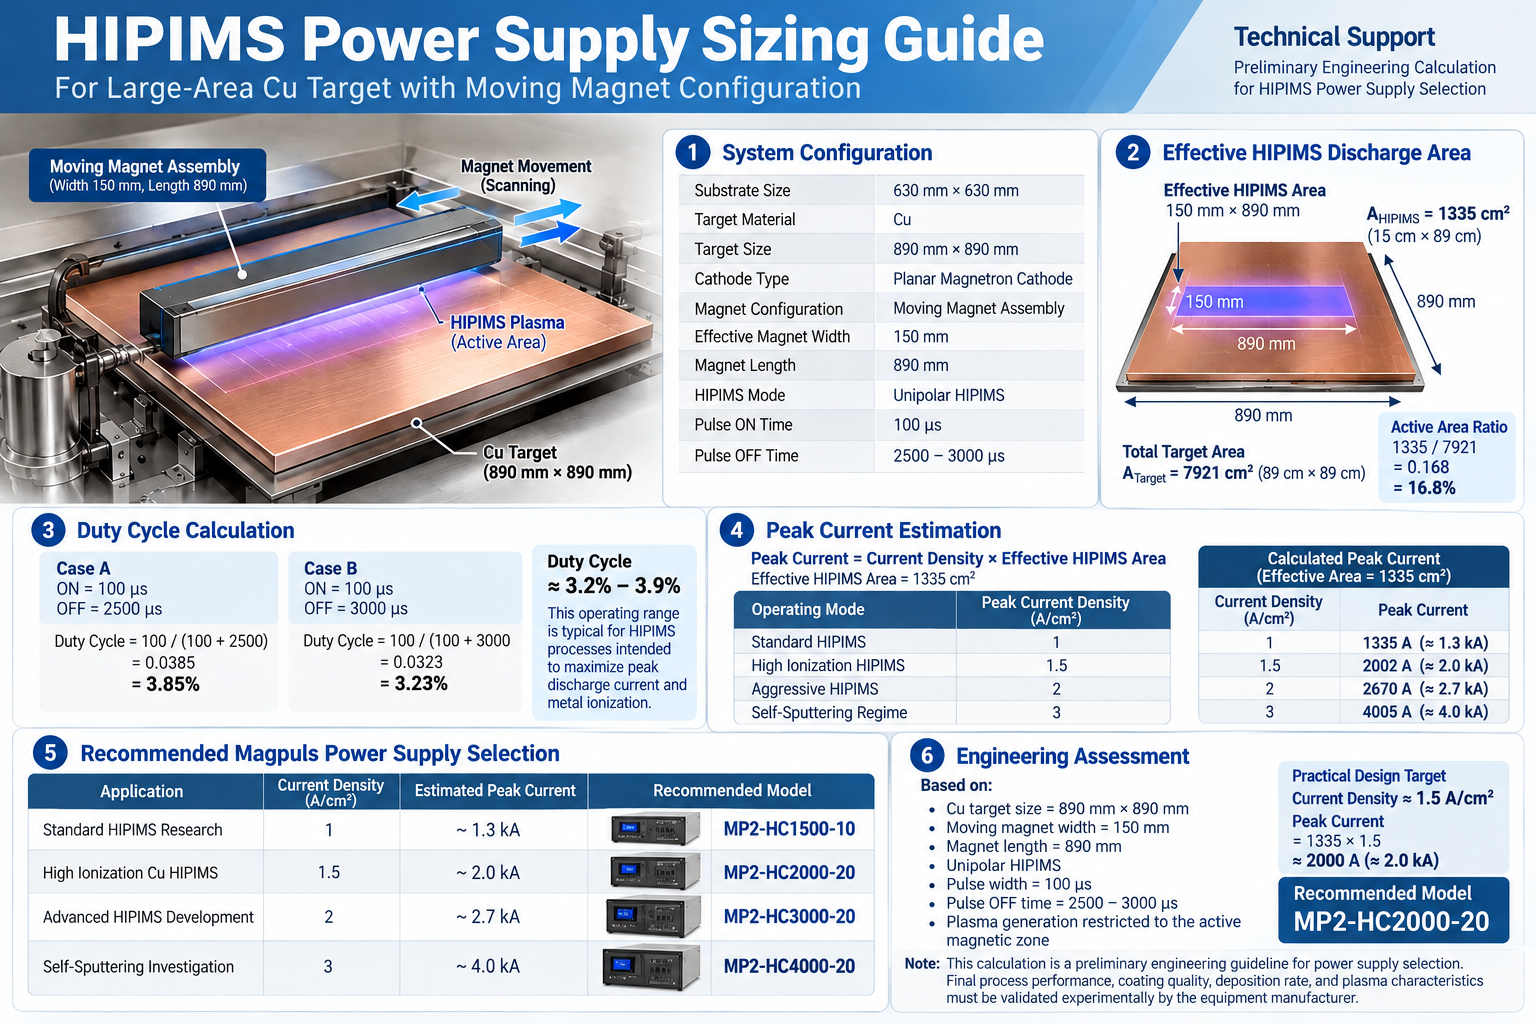
Preliminary HIPIMS Power Supply Sizing Guide (for large-area copper targets with a moving magnet assembly)

Preliminary HIPIMS Power Supply Sizing Guide

Preliminary HIPIMS Power Supply Sizing Guide

For Large-Area Copper Targets with a Moving Magnet Assembly

General Technical Support Note | October 2026

HIPIMS Power Supply Sizing Guide for Large-Area Copper Targets with Moving Magnet Configuration
Preliminary HIPIMS power supply sizing for a large-area copper target with a moving magnet assembly.
Scope. This generalized note removes the original customer-specific framing and presents the calculation as an example that can be adapted to other large-area HIPIMS systems.

1. Objective

This guide presents a preliminary method for estimating the required peak pulse current and selecting a suitable HIPIMS power supply for a large-area copper (Cu) cathode using a moving magnet assembly.

It is intended as an initial engineering guideline for equipment design and power-supply selection. Actual process performance, coating quality, deposition rate, and plasma characteristics must be validated on the specific coating system.

2. Example System Configuration

Parameter Example specification
Substrate size630 mm x 630 mm
Target materialCopper (Cu)
Target size890 mm x 890 mm
Cathode typePlanar magnetron cathode
Magnet configurationMoving magnet assembly
Effective magnet width150 mm
Magnet length890 mm
HIPIMS modeUnipolar HIPIMS
Pulse ON time100 microseconds
Pulse OFF time2,500-3,000 microseconds

3. Effective HIPIMS Discharge Area

For this example, the active discharge region is assumed to be the area directly above the moving magnetic field. This is an engineering assumption and must be confirmed against the actual magnetic-field and cathode configuration.

Effective HIPIMS area = 150 mm x 890 mm = 15 cm x 89 cm = 1,335 cm^2
Total target area = 89 cm x 89 cm = 7,921 cm^2
Active area ratio = 1,335 / 7,921 = 0.168, or approximately 16.8%

Under this assumption, approximately 16.8% of the target area is active in the discharge zone at a given moment. The plasma zone moves as the magnet assembly scans.

4. Duty Cycle Calculation

Case A: ON time = 100 microseconds; OFF time = 2,500 microseconds.

Duty cycle = ON / (ON + OFF) = 100 / (100 + 2,500) = 3.85%

Case B: ON time = 100 microseconds; OFF time = 3,000 microseconds.

Duty cycle = 100 / (100 + 3,000) = 3.23%

The example duty-cycle range is therefore approximately 3.2%-3.9%. The suitable operating range depends on the intended process window and the capabilities of the complete system.

5. Peak Current Estimation

A first-order estimate of peak current can be made by multiplying the assumed peak current density by the effective discharge area.

Estimated peak current = peak current density x effective HIPIMS area
Illustrative operating mode Assumed current density Estimated peak current
Standard HIPIMS1 A/cm^21,335 A (about 1.3 kA)
High-ionization HIPIMS1.5 A/cm^22,002 A (about 2.0 kA)
Advanced HIPIMS development2 A/cm^22,670 A (about 2.7 kA)
Self-sputtering investigation3 A/cm^24,005 A (about 4.0 kA)

These current-density values are illustrative sizing assumptions, not guaranteed operating points. The achievable peak current depends on the power supply, cathode impedance, pulse waveform, magnetic field, and process conditions.

6. Illustrative Power Supply Selection

The following model mapping is an example based on one power-supply product range. Confirm current product availability, ratings, compatibility, and operating limits with the relevant manufacturer before specifying equipment.

Application Estimated peak current Example model
Standard HIPIMS researchAbout 1.3 kAMP2-HC1500-10
High-ionization Cu HIPIMSAbout 2.0 kAMP2-HC2000-20
Advanced HIPIMS developmentAbout 2.7 kAMP2-HC3000-20
Self-sputtering investigationAbout 4.0 kAMP2-HC4000-20

For the example configuration, a design point near 1.5 A/cm^2 gives an estimated peak current of approximately 2.0 kA. A supply rated for that operating region may be a reasonable starting point for technical evaluation, subject to manufacturer confirmation and system testing.

7. Engineering Considerations

The example estimate is based on a 890 mm x 890 mm Cu target, a 150 mm x 890 mm active magnetic zone, unipolar HIPIMS, a 100-microsecond pulse ON time, and a 2,500-3,000-microsecond pulse OFF time.

A moving-plasma configuration may offer potential benefits such as improved target utilization, reduced localized heating, less concentrated erosion tracks, and improved large-area process scalability. These outcomes are design-dependent and should be verified experimentally.

Before final selection, review the magnetic-field distribution, cathode geometry, target thickness, working pressure, gas composition, substrate bias, pulse waveform, required deposition rate, and target film properties.

8. Validation and Disclaimer

This document is a preliminary engineering sizing guide only. It is not a guarantee of process performance, coating quality, deposition rate, or suitability for a particular machine.

Final power-supply selection and process optimization should be performed with the equipment manufacturer using the actual cathode, magnet assembly, electrical configuration, and coating process. All example values and model references must be checked against current manufacturer specifications.

Important: All calculations and product references are preliminary examples. Confirm the actual system parameters and current manufacturer specifications before final design or procurement.

HIPIMS Power Supply Configuration for Laboratory-Scale Thin Film Deposition

Technical Support

HIPIMS Power Supply Configuration for Laboratory-Scale Thin Film Deposition

General Technical Support Guide

Applied Optivac Technology, Inc. · October 2026
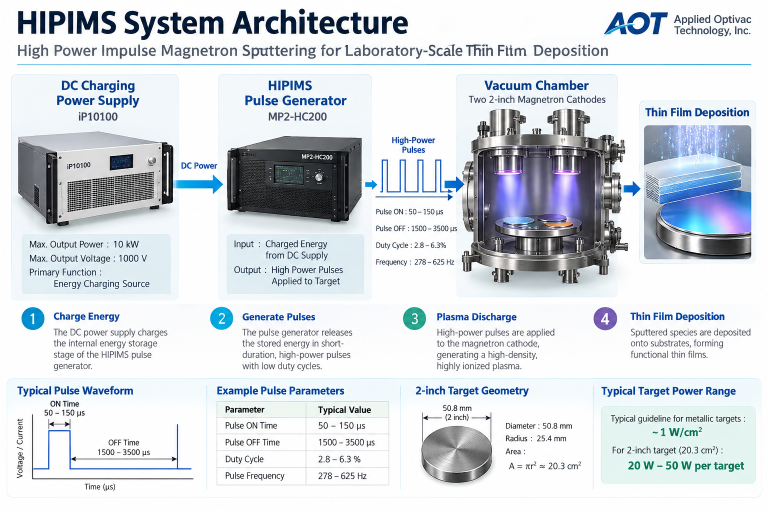
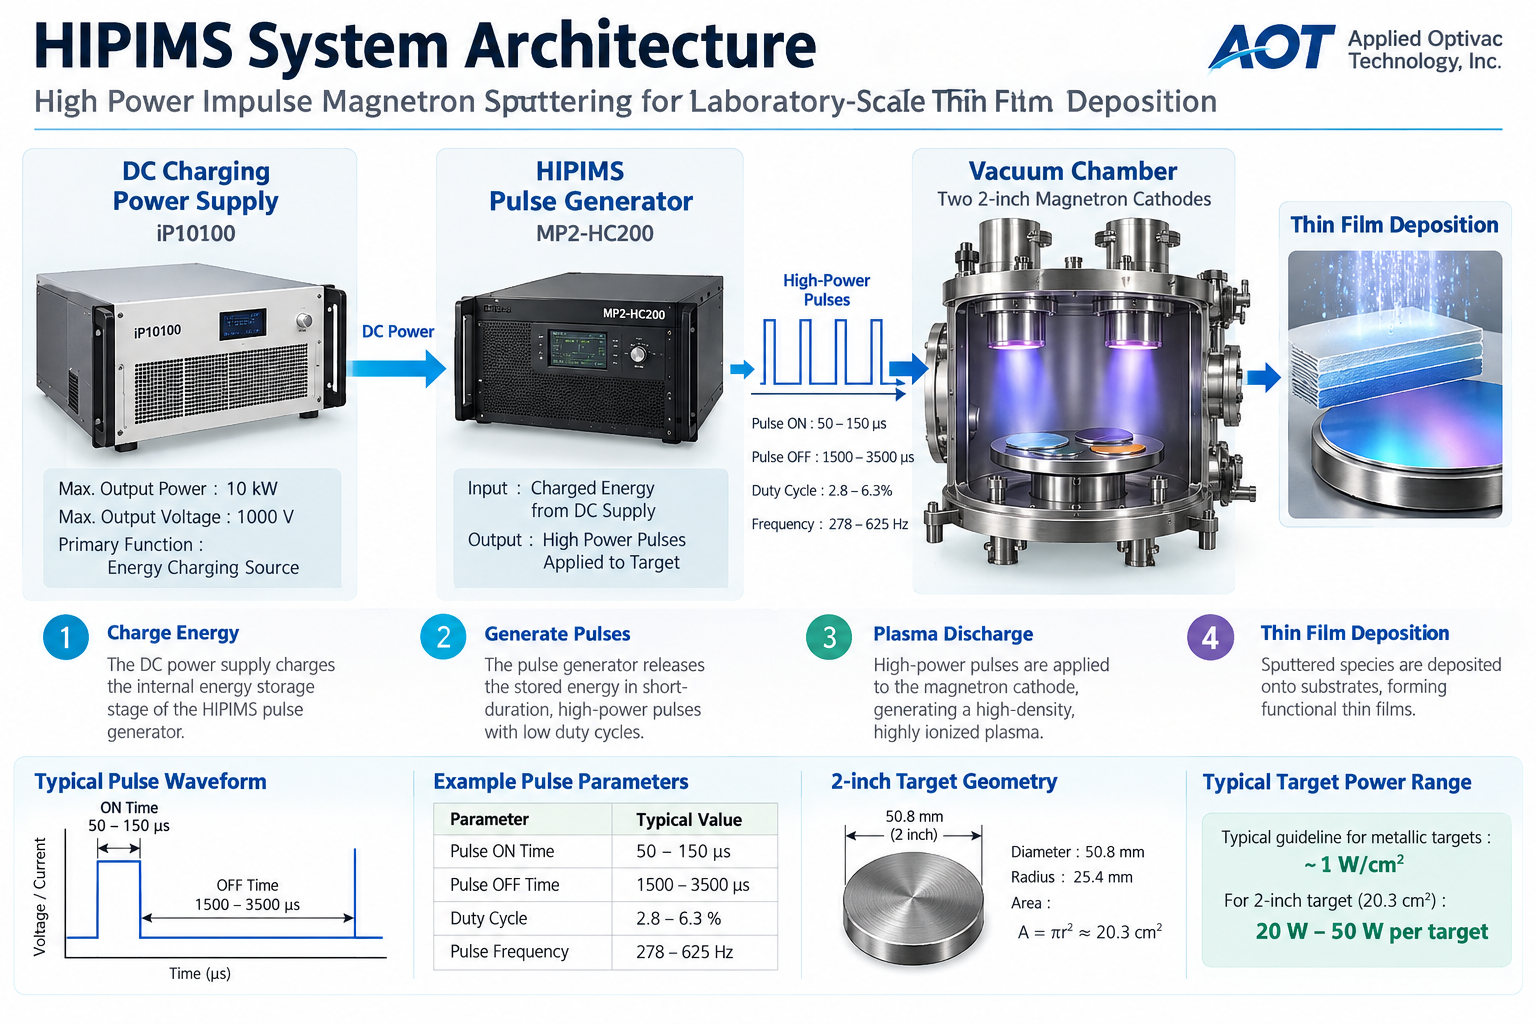
HIPIMS system architecture and thin-film deposition process

1. Purpose and Scope

This guide introduces a representative power-supply architecture for laboratory-scale High Power Impulse Magnetron Sputtering (HIPIMS). It explains the roles of a DC charging supply and a HIPIMS pulse generator, summarizes example pulse calculations, and provides a checklist for preliminary system evaluation.

This is general technical information for engineering discussion. It is not a system-specific design approval, performance guarantee, commissioning procedure, or substitute for current manufacturer documentation.

2. Representative Laboratory Configuration

The following values describe one example configuration. They should not be interpreted as universal requirements for HIPIMS equipment.

ItemExample configuration
Vacuum chamberØ250 mm × 300 mm
Substrate holderØ80 mm
Magnetron cathodesTwo 2-inch cathodes
Initial target materialsCopper (Cu) and titanium (Ti)
Possible research extensionsTiN, TiO₂, SiO₂, Si₃N₄ and other functional films, where the target, gas delivery and process controls are suitable
DC charging supply exampleiP10100; maximum output power 10 kW; maximum output voltage 1000 V
HIPIMS pulse generator exampleMP2-HC200

Confirm model specifications, electrical interfaces, operating limits and approved combinations with the equipment manufacturers before integration.

3. System Architecture

DC charging power supply
↓
HIPIMS pulse generator / energy-storage stage
↓
Magnetron cathode
↓
HIPIMS plasma discharge
↓
Thin-film deposition

In this architecture, the DC supply provides energy to charge the pulse generator’s energy-storage stage. The pulse generator delivers controlled, short-duration high-power pulses to the cathode.

The DC supply’s nameplate rating is not, by itself, the continuous power applied to the target. Target peak power, average power and energy per pulse depend on the pulse generator, settings, load and component limits.

4. HIPIMS Operating Principle

Conventional DC sputtering applies power continuously. HIPIMS instead accumulates energy and releases it in short, high-power pulses. This operating mode can generate a highly ionized plasma; peak pulse conditions and average thermal loading are distinct quantities.

  1. Energy is supplied by the DC power source.
  2. Energy is accumulated in the pulse generator’s energy-storage stage.
  3. Stored energy is released as a short pulse.
  4. A high-density plasma is generated near the target.
  5. The system returns to its charging phase before the next pulse.

5. Example Pulse Parameters and Calculations

ParameterIllustrative value
Pulse ON time100 μs
Pulse OFF time1500–3500 μs
Duty cycleApproximately 2.8–6.3%
Pulse repetition frequencyApproximately 278–625 Hz
Duty cycle = ON time ÷ (ON time + OFF time) × 100%

For 100 μs ON and 1500 μs OFF, the duty cycle is approximately 6.25% and the repetition frequency is approximately 625 Hz. For 100 μs ON and 3500 μs OFF, the duty cycle is approximately 2.78% and the repetition frequency is approximately 278 Hz.

These are calculation examples, not recommended settings for every system. Verify pulse width, repetition rate, peak current, energy per pulse and average power against the specific generator, cathode, load and process limits.

6. Preliminary Target-Area Estimate

For a nominal 2-inch target, diameter = 50.8 mm and radius = 25.4 mm. The nominal circular face area is:

A = πr² ≈ 20.3 cm²

At a reference value of 1 W/cm², this area corresponds to approximately 20 W. A 20–50 W-per-target range may be useful as a rough starting reference in some conventional sputtering discussions, but it is not a validated HIPIMS setpoint or universal operating limit.

HIPIMS evaluation must consider peak power and current density as well as average power. Establish actual conditions using the target and cathode ratings, pulse-generator limits, cooling capacity, process objectives and validated procedures.

7. How to Interpret a 10 kW DC Supply

A 10 kW DC supply may appear oversized when compared with a small target’s average power. In a pulse-generator architecture, however, the DC supply’s rating describes its charging capability; it does not independently determine the power delivered to the target during each pulse.

Review the charging voltage/current range, pulse-generator input requirements, energy-storage limits, repetition rate, load compatibility, thermal management, grounding, interlocks and protective functions. Confirm that the selected components are specified to operate together.

8. Potential Research Applications

  • Copper and titanium thin-film deposition studies
  • Process-parameter optimization
  • Plasma diagnostics and discharge characterization
  • Film density and film-property evaluation
  • Reactive deposition studies for nitride or oxide films, where suitably configured
  • Optical interference coatings and other functional thin films

Achievable film properties depend on the complete process, including target and substrate materials, chamber pressure, gas composition and flow, substrate bias and temperature, target-to-substrate geometry, pulse conditions and other process variables.

9. Preliminary System Review Checklist

  • Verify current model specifications and electrical/interface requirements for both power units.
  • Confirm charging voltage and current compatibility, pulse-energy limits and repetition-rate limits.
  • Check target and cathode ratings, cooling, cables, connectors and grounding.
  • Review vacuum and gas-delivery systems, including reactive-process controls where applicable.
  • Confirm interlocks, over-current/over-voltage protection and emergency shutdown arrangements.
  • Agree on commissioning tests and operating limits with the equipment suppliers before process use.

10. Technical Assessment and Conclusion

A DC charging supply paired with a dedicated HIPIMS pulse generator is a coherent architecture for laboratory-scale pulsed magnetron sputtering when the selected components are properly matched. The DC supply charges the pulse generator, and the pulse generator controls the pulses delivered to the cathode.

For the example described in this guide, the proposed architecture uses an iP10100 DC supply and an MP2-HC200 pulse generator. Final suitability must be established through current model-specific documentation, interface checks, load and thermal evaluation, and safe commissioning. This guide is a starting point for technical discussion, not a blanket certification of compatibility.

Important Notice

All values and examples are provided for general technical support and preliminary engineering discussion. They do not guarantee performance or approve a particular installation. Follow current equipment manuals, applicable standards, site procedures and safety requirements.
Applied Optivac Technology, Inc. · October 2026
General technical information only. Confirm component compatibility and operating limits with the relevant equipment manufacturers before implementation.

電漿溫度的量測方法

實驗模型的建立與電漿溫度量測方法的探討 歐特威科技股份有限公司
湛本岱 2025.4.28

模型
有一個真空製程腔體安裝了真空抽氣幫浦組合(mechanical pump+roots pump+turbo molecular pump)持續運轉下維持壓力在3 mtoor,同時使用兩支質流量計(mass flow controller)個別導入背景氣體Ar (100 sccm)與反應性氣體O2 (10 sccm),在真空腔體側面器壁內側安裝了一支磁控濺射靶座,靶座上安裝了一塊水冷的靶材(尺寸LxWxD: 800mm x 125mm x 5mm),靶座背面鎖死在腔體的內側,並採用高真空用的O環 (O-ring)對高壓電極導入(feedthrough)做高真空的氣密(洩漏率小於2E-9 torr),高壓電極導入在大氣壓力側,正極與負極分別接上脈衝電源供應器的正極輸出與負極輸出,這組脈衝電源供應器可以提供800V,35A的電力,在磁控把表面產生電漿。電漿裡面的組成元素有Ar與O2。想要量測磁控濺射靶表面的Ar, O2的離子溫度與分布,請分析並提供使用破壞性量測(destructive measurement)與非破壞性量測(non-destructive measurement)這兩種量測方法的各種可能作法。

思路邏輯分析
針對這個特定的磁控濺射腔體製程環境下,量測Ar$^+$和O$_2^+離子的溫度與分佈,考量到腔體結構、氣體種類、以及靶材尺寸等因素,以下分析破壞性與非破壞性量測方法的可能作法、優缺點與實施上的挑戰。∗∗重要考量因素:∗∗1.∗∗磁控濺射電漿特性:∗∗電漿密度高、非均勻性強,特別是在靶材表面附近有強烈的磁場梯度。2.∗∗靶材尺寸與位置:∗∗800mmx125mm的大尺寸靶材固定在腔壁,限制了腔內可用的空間,也使得探針或光學路徑的進入和掃描變得困難。3.∗∗反應性氣體(O2):∗∗O2電漿具有氧化性,可能對探針或光學視窗造成腐蝕或污染。4.∗∗低氣壓(3mTorr):∗∗雖然是低氣壓,但對於離子而言仍是碰撞性環境,離子能量分佈會受碰撞影響。5.∗∗脈衝電源:∗∗電漿參數(包括離子能量分佈)可能隨脈衝變化,需要具備時間解析度的量測能力。∗∗量測方法分析:∗∗∗∗A.破壞性量測(DestructiveMeasurement)∗∗這類方法需要將量測裝置插入到電漿中,會對電漿狀態產生一定程度的擾動,且裝置表面容易受到濺射沉積物的污染。1.∗∗探針式離子能量分析儀(Probe−basedRetardingFieldEnergyAnalyzer,RFEA)或結合質譜儀的探針(Probe−basedMassSpectrometer/EnergyAnalyzer):∗∗∗∗∗作法:∗∗∗將一個帶有小孔(或多個小孔)的探針頭插入到電漿中。探針內部通常包含多個柵極電極,用於過濾電子並對離子施加反向偏壓,分析不同能量的離子數量。∗為了區分Ar^+$和O$_2^+,探針需要結合質量分析器,最常見的是四極質譜儀(QuadrupoleMassSpectrometer,QMS)或飛行時間質譜儀(Time−of−FlightMassSpectrometer,TOF−MS)。探針頭作為取樣點,將離子引導至質譜儀進行質量篩選和能量分析。∗透過在不同位置移動探針,可以量測離子能量分佈的空間變化。∗∗∗量測能力:∗∗可以直接量測特定位置處Ar^+$和O$_2^+的離子能量分佈函數(IEDF)。離子溫度可以從IEDF的高能尾部或通過擬合麥克斯韋分佈來估算,但需注意磁控電漿的IEDF通常是非麥克斯韋分佈的。量測位置決定了空間分佈的獲取。∗∗∗優點:∗∗可以獲得種別特異性(species−specific)的離子能量分佈,是直接量測離子能量的最佳方法。∗∗∗缺點與挑戰:∗∗∗∗∗物理擾動:∗∗探針的插入會顯著擾動電漿,特別是在靶材附近的高密度區域。∗∗∗沉積污染:∗∗濺射沉積物會在探針表面(特別是取樣孔)累積,影響量測準確性,需要定期清潔或更換探針。∗∗∗熱負載:∗∗高密度電漿可能對探針造成較大的熱負載。∗∗∗空間限制:∗∗靶材尺寸大且貼壁安裝,很難在靶材表面附近進行全面的探針掃描。可能只能在離靶材一定距離或腔體邊緣處量測。∗∗∗脈衝同步:∗∗需要量測設備與脈衝電源同步,以獲取時間分辨的IE​​DF。∗∗∗O2腐蝕:∗∗O2電漿可能腐蝕探針材料。∗∗B.非破壞性量測(Non−destructiveMeasurement)∗∗這類方法不將量測裝置插入電漿內部,通常通過光學或從腔壁取樣的方式進行。1.∗∗光學發射光譜儀(OpticalEmissionSpectroscopy,OES):∗∗∗∗∗作法:∗∗∗通過腔體側面的光學視窗收集電漿發出的光。∗使用光譜儀分析光的波長和強度。Ar^+$和O$_2^+$都有特徵的發射譜線。 * 通過狹縫或光纖探頭在不同位置採集光信號,或使用具有空間解析度的成像光譜儀,可以獲取發射強度的空間分佈,間接反映激發態離子密度的分佈。 * 離子溫度估算: 可以通過量測特定離子發射譜線的多普勒展寬 (Doppler Broadening) 來估算離子溫度。然而,這需要高解析度的光譜儀,並且要排除其他展寬機制(如斯塔克展寬、壓力展寬、儀器展寬)的影響,特別是對於分子離子O$_2^+$,其譜線可能更複雜。 * 量測能力: 可以識別電漿中的發光物種(包括離子),獲得激發態離子的相對空間分佈。可以嘗試利用多普勒展寬估算離子溫度,但準確性可能不高。 * 優點: 非侵入性,對電漿擾動小;設備相對常見。可以快速獲取大範圍的空間分佈信息(如果結合掃描或成像)。 * 缺點與挑戰: * 間接性: OES量測的是激發態物種,與基態離子密度和溫度不是直接關係,中間涉及到複雜的激發和輻射過程。 * 線積分: 標準的OES是沿著視線方向的光積分,獲取精確的局部空間分佈需要斷層掃描 (Tomography) 技術或非常精細的空間採集。 * 溫度量測難度: 利用多普勒展寬量測離子溫度需要高解析度設備,且難以排除其他展寬效應,對O$_2^+尤其困難。∗∗∗視窗污染:∗∗濺射沉積物會污染光學視窗,影響光信號的穿透。2.∗∗雷射誘致螢光光譜法(Laser−InducedFluorescenceSpectroscopy,LIF):∗∗∗∗∗作法:∗∗∗使用可調諧的雷射發射特定波長的雷射束,精確激發目標離子(Ar^+$或O$_2^+)從基態(或亞穩態)到激發態的躍遷。∗量測離子從激發態躍遷回基態或其他亞穩態時發出的螢光信號。∗通過掃描雷射的頻率,可以獲得離子吸收譜線的輪廓。譜線的∗∗多普勒展寬∗∗直接反映了離子的速度分佈,從而計算出離子溫度。∗通過聚焦雷射束和/或收集螢光的空間區域,可以實現很高的空間解析度,並通過掃描雷射束或採集光學系統來獲取空間分佈。∗∗∗量測能力:∗∗可以直接量測特定離子種別在特定空間點的∗∗速度分佈函數∗∗,從而精確獲得離子溫度。通過掃描可以獲得密度和溫度的空間分佈。∗∗∗優點:∗∗高種別特異性、高空間解析度、高時間解析度(如果使用脈衝雷射並與電漿脈衝同步)。是目前量測離子速度分佈(溫度)和密度分佈最精確的非破壞性方法之一。∗∗∗缺點與挑戰:∗∗∗∗∗設備昂貴複雜:∗∗需要昂貴的可調諧雷射系統、高靈敏度探測器和複雜的光學設置。∗∗∗需要合適的能級:∗∗需要目標離子(Ar^+$,O$_2^+$)存在合適的能級結構和躍遷波長,且雷射波長需要與之匹配(通常需要紫外或可見光波段)。O$_2^+的能級結構複雜,選擇合適的躍遷可能需要深入研究。∗∗∗光學通達:∗∗需要至少兩個(通常是相互垂直的)光學視窗,一個用於引入雷射,一個用於收集螢光。對於大尺寸靶材,在靶材附近實現全面的空間掃描可能受限於視窗位置。∗∗∗背景雜訊:∗∗需要抑制電漿自身的發射光。∗∗∗視窗污染:∗∗視窗污染會影響雷射的導入和螢光的收集。3.∗∗腔壁取樣質譜儀(Wall−samplingMassSpectrometer/EnergyAnalyzer):∗∗∗∗∗作法:∗∗∗在腔壁上開一個帶有小孔的取樣口(通常需要差分抽氣系統以維持質譜儀所需的高真空)。∗將質量分析器(如QMS或TOF−MS)直接或通過傳輸光學與取樣口連接。∗在取樣口前方或質譜儀內部添加靜電柵極,用於對通過小孔的離子進行能量分析(ExtractiveIEDF)。∗∗∗量測能力:∗∗可以量測到達取樣口位置的Ar^+$和O$_2^+離子的∗∗能量分佈∗∗。這反映的是離子在最後到達腔壁前的行為,與體相電漿中的離子能量分佈可能不同(受鞘層電位影響)。可以識別離子種類。∗∗∗優點:∗∗非侵入電漿體相;可以識別離子種類並量測到達壁面的離子能量;相較於探針更容易實現長時間量測(如果取樣孔設計合理)。∗∗∗缺點與挑戰:∗∗∗∗∗量測位置限制:∗∗只能量測到達腔壁取樣口的離子,無法直接量測體相電漿中的分佈。若要獲取空間分佈,需要在不同壁面位置開設多個取樣口,這對腔體改造要求高。∗∗∗鞘層效應:∗∗量測到的離子能量分佈受到壁面附近鞘層電位的影響。∗∗∗取樣孔污染:∗∗濺射沉積物會堵塞或改變取樣孔的特性。∗∗∗能量分析器的限制:∗∗能量分析的範圍和解析度受設備限制。

總結與建議
在這個特定的場景下,全面、準確地量測Ar^+$和O$_2^+$離子的溫度與空間分佈是非常具有挑戰性的。

  • 破壞性方法 (探針): 雖然能直接量測離子能量,但由於大尺寸靶材和空間限制,很難在靶材附近進行全面的空間掃描,且探針污染是個大問題。可能只能作為在特定可進入點進行局部量測的手段。
  • 非破壞性方法:
    • OES: 最容易實現,可以提供定性的離子空間分佈信息,但難以精確量測離子溫度。
    • LIF: 是量測離子溫度和密度空間分佈的黃金標準,但設備昂貴、複雜,且需要合適的光學通達和匹配的雷射波長,尤其O$_2^+的雷射要求高。如果能克服這些困難,LIF是獲取體相電漿中精確信息的最佳選擇。∗∗∗腔壁取樣質譜儀:∗∗可以獲取到達腔壁的離子能量分佈,提供壁面附近的離子信息,但無法反映體相電漿的分佈。∗∗建議的實際操作步驟:∗∗1.∗∗初步探測(OES):∗∗首先使用OES通過現有視窗進行初步的光譜分析,確認Ar^+$和O$_2^+的發射譜線,並嘗試通過簡單的空間掃描(如果可能)獲取發射強度的粗略分佈,了解離子的相對豐度和大致分佈範圍。2.∗∗考慮非破壞性方法優先:∗∗鑑於靶材尺寸和沉積問題,優先考慮非破壞性方法。∗∗∗若預算和技術允許:∗∗評估LIF的可行性。研究Ar^+$和O$_2^+是否存在適合用雷射激發的躍遷,以及雷射設備的可用性。評估腔體開視窗的可能性和位置,以實現必要的雷射導入和螢光收集光路。LIF是獲得準確溫度和空間分佈的最佳途徑。∗∗∗若預算有限或LIF難度過高:∗∗考慮安裝腔壁取樣質譜儀。在幾個關鍵的壁面位置開取樣口(例如靶材對面、側面等),量測到達壁面的離子能量分佈。這不能提供體相分佈,但能提供壁面附近的離子能量信息,對了解離子對基板或腔壁的轟擊行為有幫助。3.∗∗考慮有限的破壞性量測(如果必要):∗∗如果壁面取樣質譜儀的信息不足,且LIF無法實現,可以考慮在腔體邊緣或離靶材較遠、對電漿擾動相對較小的區域,通過現有或新增的真空法蘭引入探針式離子能量分析儀或結合質譜儀的探針,進行幾個點的量測。這無法提供全面的空間分佈,但能獲取特定點的離子能量信息。需要考慮探針的保護和清潔機制。總之,在這個特定的磁控濺射腔體中,獲得詳細的Ar^+$和O$_2^+$離子溫度和空間分佈信息是一個複雜的任務。最理想且信息最豐富的方法是LIF,但成本和技術要求很高。退而求其次可以考慮結合壁面取樣質譜儀和有限點的探針量測,或者僅利用OES獲取定性分佈和嘗試估算溫度(準確性待驗證)。在實施任何方法之前,都必須仔細評估對腔體結構的影響、沉積污染問題、以及設備與脈衝電源的同步需求。

思路邏輯分析

以下是生成 OES 和 LIF 原則詳細說明的思考過程:

  • 瞭解請求: 使用者希望詳細瞭解直讀光譜 (OES) 和激光誘導螢光 (LIF) 背後的原理,特別是在等離子體診斷的背景下。解釋應涵蓋它們的工作原理和測量內容,對比它們的能力,特別是離子特性(儘管一般原則也適用於中性)。
  • 解構請求:
    • 解釋 OES 原理。
    • 解釋 LIF 原理。
    • 解釋它們如何用於電漿診斷。
    • 突出顯示它們與測量物質 (離子)、溫度和分佈的相關性(隱式連結回上一個查詢)。
    • 使用清晰的語言和可能的圖表(概念性描述,因為我不會畫)。
  • 規劃結構:
    • 簡介:簡要說明兩者都是電漿診斷中使用的光學方法。
    • 直讀光譜 (OES):
      • 核心原理:等離子體發光。為什麼?電子碰撞激發,輻射衰變。
      • 測量內容:發射光子的波長和強度。
      • 獲得哪些資訊:
        • 物質鑒定(將波長與已知的原子/分子光譜進行比較)。
        • 相對物種豐度(比較線強度 – 注意:與密度不是線性相關)。
        • 激發溫度(來自同一物種的不同譜系的強度比  – 注意:通常不是真正的熱平衡)。
        • 多普勒展寬(對於 溫度 或速度分佈 – 解釋效果及其使用方法,提及離子的限制)。
        • 空間分佈(使用空間解析度技術)。
      • 設置:等離子體源 -> 收集光學元件 -> 光譜儀 -> 探測器。
      • 總結要點(電漿診斷的優點/缺點)。
    • 激光誘導螢光 (LIF):
      • 核心原理:使用激光 主動 激發特定躍遷,然後檢測隨後的螢光。
      • 為什麼使用鐳射?對興奮的特異性和控制。
      • 過程:
        • 吸收:調諧到目標物質的特定吸收線的可調諧鐳射。
        • 激發:物質吸收光子並進入更高的能量狀態。
        • 螢光:激發的物質衰變,發射光子(通常與原始狀態不同)。
        • 檢測:收集和檢測螢光光子(通常與鐳射的波長不同,以減少散射雜訊)。
      • 獲得哪些資訊:
        • 物質鑒定(通過找到諧振吸收波長)。
        • 絕對 或 相對 密度(積分螢光強度)。
        • 速度分佈函數 (VDF) / 溫度:通過掃描吸收線上的激光頻率並測量螢光強度分佈。輪廓的寬度由非碰撞或弱碰撞狀態的多普勒效應決定,直接給出 VDF,從而給出鐳射束方向的溫度。
        • 空間分佈:通過聚焦鐳射器和/或從特定體積收集螢光,並掃描該體積。
        • 流速(線路中心的多普勒頻移)。
      • 設置:鐳射 -> 光束傳輸光學器件 -> 等離子體 -> 收集光學器件 ->光譜儀/檢測器 -> 信號處理。
      • 總結要點(電漿診斷的優點/缺點)。
    • 比較/關係: 它們如何互補?OES 用於概覽/輕鬆監控;LIF 用於精確的、特定於物種的、空間分辨的 VDF/溫度/密度。
    • 與濺射中 Ar+ 和 O2+ 的相關性: 簡要介紹這些方法如何應用於使用者的特定離子,重申挑戰(離子溫度的 OES、O2+ 複雜性的 LIF、光學訪問、濺射沉積)。
  • 起草解釋(反覆運算過程):
    • OES: 從基本概念開始 – 等離子體發光。為什麼?電子碰撞激發原子/分子/離子。它們通過發光來去激發。每個物種都有獨特的波長「指紋」。強度取決於密度、電子能量、躍遷概率。如何獲取溫度?多普勒展寬 – 解釋這個想法(移動發射器會改變頻率)。提到它更難處理離子,而且通常不如 LIF 精確。提及空間解析度是可能的,但通常是線集成的。
    • LIF: 首先需要比 OES 更具體的資訊。OES 看到了已經興奮的東西;LIF 讓 一些東西變得興奮。使用鐳射,因為它是單色且可調諧的。解釋吸收螢光過程。強調您 掃描 的激光頻率。為什麼要掃描?因為朝向/遠離鐳射的原子吸收的頻率略有不同(多普勒效應)。掃描時吸收曲線的形狀是 VDF。VDF 給出溫度。強調物種特異性和空間解析度能力。提到它更複雜、更昂貴。
    • 改進語言: 使用“輻射衰變”、“電子碰撞激發”、“光譜線”、“多普勒展寬”、“速度分佈函數 (VDF)”、“可調諧鐳射”、“螢光”等術語。解釋 為什麼 一個人可能會使用一個而不是另一個。使用 LaTeX 作為離子名稱 (Ar$^+$, O$_2^+)。確保他們直接∗∗測量和他們∗推斷∗之間的區別是明確的(OES測量發射光強度/波長,推斷密度/溫度;LIF測量螢光與激光頻率,直接測量VDF /溫度).∗∗AddDiagrams(Conceptual):∗Describethesetupforeachmethod.ForOES:lightcollectedfromplasma−>intoesspectrometer.對於LIF:鐳射束進入等離子體+光收集∗從不同的角度/位置∗−>進入探測器/光譜儀。這有助於可視化差異(被動vs.主動,體積選擇).∗∗Connectback:∗簡單地重申,對於Ar^+$ 和 O$_2^+$ 溫度/分佈,LIF 通常是準確性的首選,但 OES 對於篩選和相對分佈很有用。
  • 最終審核:根據使用者的請求檢查清晰度、準確性、邏輯流程和完整性。確保兩種方法之間的區別清晰。確保清楚地解釋了如何從每種方法獲得溫度(兩種方法的多普勒展寬,但獲得輪廓的機制明顯不同 – 被動發射與主動激光掃描)。確保正確使用術語。

推薦: 用於製程開發、生產控制和機器學習的尖端等離子體監控技術

Cutting-Edge Plasma Monitoring Techniques for Process Development, Production Control and Machine Learning

Speaker: Dr. Thomas Schütte – PLASUS GmbH

2025/5/20 am10:10 – am10:30 TechCon 2025

隨著薄膜行業的規格要求越來越高,高產量和經濟高效的生產是這個競爭激烈的市場的主要因素。這些目標推動了對高效過程監測和控制系統的需求。此外,使用人工智慧和機器學習 (ML) 技術的數據分析近年來取得了巨大進步,引發了人們對使用這些方法進行等離子體應用診斷和控制的興趣。
EMICON等離子體監測和過程控制平臺以合理的成本和資源將不同的尖端感測器技術結合到一個系統中:具有前所未有的時間解析度的多通道光譜等離子體監測,用於即時原位膜厚測量的廣波域反射計,HIPIMS和脈衝等離子體應用中的電壓和電流的電脈衝曲線測量,來自等離子體(V-I)探頭等其他感測器的信號輸入, lambda 探頭、離子計探頭等從所有感測器採集的數據在 EMICON 系統中同時處理,並且可以組合和評估,以同時即時控制等離子體參數(如反應氣體流量或離子密度)和產品參數,即膜厚或顏色。這不僅提高了生產穩定性和產品品質,還為機械學習(ML)分析提供可靠與全面性的數據。
介紹來自不同要求苛刻的濺射和 PECVD 應用的示例,展示了 EMICON 平臺的強大優勢,該平臺結合了感測器技術等離子體監測、電氣測量和光度測量以及實時數據處理。

Name

Cutting-Edge Plasma Monitoring Techniques for Process Development, Production Control and Machine Learning

Date

2025年5月20日 Tuesday

Time

am10:10 – am10:30

Description

Thomas Schütte, Jan-Peter Urbach, Peter Neiß, Marius Radloff, Hokuto Kikuchi, PLASUS GmbH, Mering, Germany

As specifications in the thin film industry become more and more demanding, high production yields and cost-effective production are major factors in this competitive market. These goals drive the demand for efficient process monitoring and control systems. In addition, data analysis using artificial intelligence and machine learning (ML) technologies has made tremendous progress in recent years, sparking interest in using these methods for the diagnostics and control of plasma applications.
The EMICON plasma monitoring and process control platform provides different cutting-edge sensor techniques combined in a single system at reasonable costs and resources: multi-channel spectroscopic plasma monitoring with unprecedented time resolution, broadband reflectometry for real-time in-situ layer thickness measurement, electrical pulse curve measurement of voltage and current in HIPIMS and pulsed plasma application, signal input from other sensors like plasma (V-I) probes, lambda probes, ion meter probes, etc. The acquired data from all sensors are processed simultaneously in the EMICON system and can be combined and evaluated for controlling the plasma parameters like reactive gas flow or ion density and the product parameters, i.e. layer thickness or color simultaneously and in real-time. This results not only in enhanced production stability and improved product quality but it also provides reliable and comprehensive data for ML analysis.
Examples from different demanding sputtering and PECVD applications are presented demonstrating the powerful benefits of the EMICON platform that combines sensor techniques plasma monitoring, electrical measurements and photometric measurements and real-time data processing.

Speakers

Thomas Schütte – PLASUS GmbH

推薦: 通過脈衝分辨光譜和電等離子體製程控制即時優化 HIPIMS 製程

Optimizing HIPIMS Processes in Real-Time by Pulse-Resolved Spectroscopic and Electrical Plasma Process Control

Speaker: Jan-Peter Urbach – PLASUS GmbH

2025/5/22 pm3:40 – pm4:00 SVC TechCon 2025

HIPIMS製程和其他脈衝等離子體製程越來越多地用於研發和生產的塗層應用。瞭解和控制脈衝中顆粒密度的行為對於在沉積速率、薄膜成分和形態方面進一步優化塗層製程至關重要。這需要能夠即時獲取脈衝分辨過程數據的等離子體監控和過程控制技術。
光譜和電等離子體監測和過程控制技術的最新發展克服了僅進行脈衝平均數據採集的限制。此外,它現在即時提供脈衝分辨粒子密度資訊。
本演示將以合理的費用在多通道設置中演示具有前所未有的時間解析度和採樣率的連續、脈衝解析度和電學數據採集。由於最小積分時間比典型的 HIPIMS 脈衝小得多,因此可以實時監測粒子密度的時間行為以及脈衝內的電壓和電流。此功能有助於研究和瞭解不同製程參數(例如不同的脈衝模式和模式)下 HIPIMS 脈衝中的顆粒動力學。特別是,可以跟蹤脈衝分辨顆粒的組成,從而可以動態優化電離度和金屬與反應氣體的比例。這項新技術為研發人員提供了新的機會,以定製具有先進或新性能的塗層,並將提高工業應用中的製程穩定性和生產品質。

Name

Optimizing HIPIMS Processes in Real-Time by Pulse-Resolved Spectroscopic and Electrical Plasma Process Control

Date: 2025年5月22日 Thursday

Time: pm3:40 – pm4:00

Description

Jan-Peter Urbach1, Thomas Schütte1, Holger Gerdes2, Peter Neiß1, Marius Radloff1, Hokuto Kikuchi1, Ralf Bandorf2
1PLASUS GmbH, Mering, Germany
1Fraunhofer Institute for Surface Engineering and Thin Films IST, Braunschweig, Germany

HIPIMS processes and other pulsed plasma processes are used more and more for coating applications in R&D and production. Understanding and controlling the behavior of particle densities in the pulse is essential to optimize the coating process further in terms of deposition rate, film composition, and morphology. This requires plasma monitoring and process control technologies which are capable to acquire pulse-resolved process data in real time.
The latest development of spectroscopic and electrical plasma monitoring and process control technology overcomes the restriction of only pulse-averaging data acquisition. Furthermore, it now provides pulse-resolved particle density information in real-time.
This presentation will demonstrate the continuous, pulse-resolved spectroscopic and electrical data acquisition with unprecedented time resolution and sampling rate in a multi-channel setup at reasonable expense. As the minimum integration time is much smaller than typical HIPIMS pulses the temporal behavior of particle densities as well as voltage and current within the pulse can be monitored in real-time. This capability helps to investigate and understand the particle dynamics in the HIPIMS pulse at different process parameters such as different pulse modes and patterns. In particular, the pulse resolved particle composition can be tracked, which allows to optimize the ionization degree and the metal to reactive gas ratio on the fly. This new technology provides new opportunities for R&D to tailor coatings with advanced or new properties and will enhance process stability and production quality in industrial application.

Speakers

Jan-Peter Urbach – PLASUS GmbH

推薦: 在工業過程控制中應用人工智慧時應對有限的數據量

Coping with Limited Data Amounts When Applying Artificial Intelligence in Industrial Process Control

Speaker: Dr. Thomas Schütte – PLASUS GmbH

2025/5/19 pm12:30 – pm12:50 SVC TechCon 2025

ChatGPT 或 DeepSeek 等大型語言模型 (LLM) 的最新進展引起了人們對人工智慧在工業過程控制領域的前景的極大興趣。LLM 和其他基於深度學習架構的方法依賴於用於訓練模型的非常大的數據集。

在工業環境中,生成全面且經過驗證的數據點通常需要花費大量時間和金錢。單個數據點需要在感興趣的過程中處理至少一個樣品,並在之後進行大量測量和測試,以表徵產品的性能。來自各個運行的過程參數必須與表徵結果的結果一起以機器可讀的格式存儲。瓶頸通常是必要的表徵測量量,這可能不是通常質量保證程式的一部分。
因此,將人工智慧 (AI) 方法應用於工業過程控制的一個主要挑戰是根據有限大小的數據集提取有意義的 AI 模型。在本次演講中,我們將介紹在“以高解析度壓電超聲波感測器為例對薄膜材料進行材料研究數位化”(DigiMatUs) 專案的背景下制定的應對策略,該專案是德國研究計劃“MaterialDigital”的一部分。在本專案中,通過機器學習研究了用於超聲換能器的 AlScN 層的反應磁控濺射。應對有限數據量的策略包括使用原位診斷技術,如等離子體監測或原位反射法,求助於物理量和引入專業知識。

Name

Coping with Limited Data Amounts When Applying Artificial Intelligence in Industrial Process Control

Date

2025年5月19日 Monday

Time

pm12:30 – pm12:50

Description

Thomas Schütte1, Jan-Peter Urbach1, Fabian Neuhaus2, Martin Glauer2, Stephan Barth3, Christian Käpplinger4
1PLASUS GmbH, Mering, Germany
2Otto von Guericke University of Magdeburg, Germany
3Fraunhofer Institute for Electron Beam and Plasma Technology FEP, Dresden, Germany
4PVA TePla Analytical Systems GmbH, Jena, Germany
The recent progress of large language models (LLMs) such as ChatGPT or DeepSeek has generated a lot of interest for the prospect of artificial intelligence in the field of industrial process control. LLMs and other approaches based on deep learning architectures rely on very large data sets that are used train the models.
In the industrial context generating comprehensive and validated data points usually requires considerable effort in terms of time and money. A single data point will require to process at least one sample in the process of interest and perform a number of measurements and tests afterwards to characterize the performance of the product. Process parameters from the respective run have to be stored together with the results of the characterization results in a machine-readable format. The bottleneck is most often the necessary amount of characterization measurements that may not be part of the usual quality assurance routine.
So, a major challenge to apply artificial intelligence (AI) methods for industrial process control is to extract meaningful AI models based on data sets of limited size. In this talk we will present strategies for this challenge that are developed in the context of the project “Digitalization of materials research on thin-film materials using the example of high-resolution piezoelectric ultrasonic sensors” (DigiMatUs) which is part of the German research initiative “MaterialDigital”. In this project, reactive magnetron sputtering of AlScN layers for the use in ultrasonic transducers is investigated by means of machine learning. Strategies to cope with the limited amount of data include the use of in-situ diagnostic techniques such as plasma monitoring or in-situ reflectometry, the recourse to physical quantities and the introduction of expert knowledge.

Speakers

Thomas Schütte – PLASUS GmbH

中頻電源進行反應式濺射鍍膜使用OES來做製程監控協助Lab值的穩定

以下是一些可用的OES光譜:

  • Ti發射譜線:
    • Ti I 215.2 nm:此譜線是電漿中整體Ti濃度的良好指標。
    • Ti II 308.9 nm:此譜線是電漿中離化Ti+濃度的良好指標。
  • N發射譜線:
    • N₂ 337.1 nm:此譜線是電漿中N₂濃度的良好指標。
    • N₂+ 391.4 nm:此譜線是電漿中N₂+濃度的良好指標。
  • Ar發射譜線:
    • Ar I 763.5 nm:此譜線是電漿中Ar濃度的良好指標。
    • Ar II 470.2 nm:此譜線是電漿中Ar+濃度的良好指標。
  • 其他譜線:
    • O I 777.4 nm:此譜線是電漿中氧污染的良好指標。
    • Hα 656.3 nm:此譜線是電漿中氫污染的良好指標。

以下是一些使用OES光譜控制Lab值的具體示例:

  • **要增加薄膜中的Ti含量,請增加Ti流量率或減少N流量率。**這將增加Ti I 215.2 nm和Ti II 308.9 nm發射譜線,並減少N₂ 337.1 nm和N₂+ 391.4 nm發射譜線。這將使Lab值向光譜的紅色端偏移。
  • **要增加薄膜中的N含量,請減少Ti流量率或增加N流量率。**這將降低Ti I 215.2 nm和Ti II 308.9 nm發射譜線,並增加N₂ 337.1 nm和N₂+ 391.4 nm發射譜線。這將使Lab值向光譜的藍色端偏移。
  • **要增加薄膜的亮度,請增加功率。**這將增加所有發射譜線的強度。
  • **要降低薄膜的亮度,請降低功率。**這將降低所有發射譜線的強度。